This page displays data on the amount of SARS-CoV-2 in Umeå and Örebro wastewater between October 2020 and June 2021. A new method was used after June 2021, and the most recent data can be found here.
The data displayed here were collected as part of a research project led by associate professor Maja Malmberg (SLU, Swedish University of Agricultural Sciences: maja.malmberg@slu.se), in collaboration with the SciLifeLab COVID-19 National Research Program, and associate professor Mette Myrmel at the Norwegian University of Life Sciences.
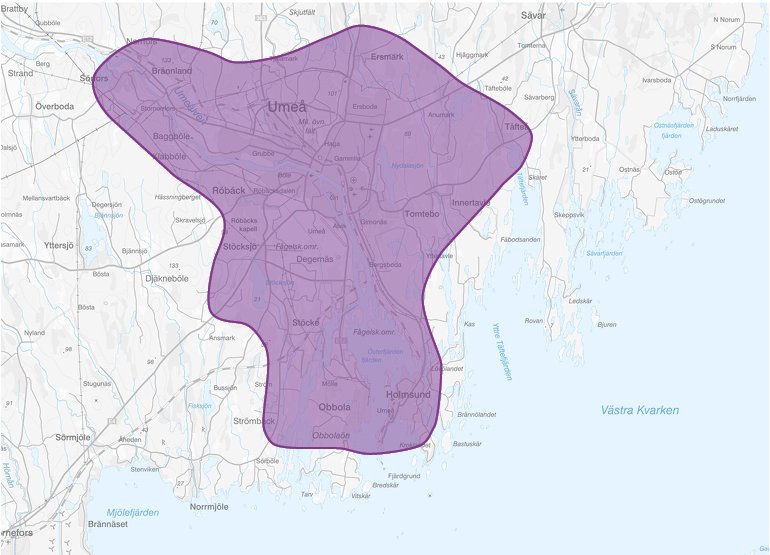
Samples of wastewater were taken from the wastewater treatment facilities in Umeå and Örebro to determine the amount of SARS-CoV-2 in wastewater. Consult the catchment area maps for Umeå and Örebro to see where the wastewater came from in each case. To determine the levels of SARS-CoV-2 in wastewater samples, ultrafiltration and qPCR were used after sample preparation. Primers previously used and verified by Corman et al. (2020) were used to detect SARS-CoV-2, and qPCR samples were normalised against the levels of pepper mild mottle virus (PMMV). Up until January 2021, three samples of wastewater were taken from each wastewater facility each week, and the results were pooled to provide a weekly estimate. After January 2021, samples were instead collected weekly.
In the plots below, the amount of SARS-CoV-2 for each week is shown relative to the amount of SARS-CoV-2 on 6th November 2020.
Amount of SARS-CoV-2 in Umeå wastewater between between October 2020 and June 2021
Download the data: Gene copy number change (%) relative to 6th Nov 2020 and flow level at each measurement, Excel file. Data are available from week 44 of 2020 until week 22 of 2021.
How to cite: Malmberg, M., Myrmel, M. & Khatri, M. (2021). Dataset of SARS-CoV-2 in wastewater in Umeå, Sweden. https://doi.org/10.17044/scilifelab.14376881.v1.
Code used to produce plot: Script to produce plot.
Amount of SARS-CoV-2 in Örebro wastewater between October 2020 and June 2021
Download the data: Gene copy number change (%) relative to 6th Nov 2020 and flow level at each measurement, Excel file. Data are available from week 44 of 2020 until week 22 of 2021.
How to cite: Malmberg, M., Myrmel, M. & Khatri, M. (2021). Dataset of SARS CoV-2 in wastewater in Örebro, Sweden. https://doi.org/10.17044/scilifelab.14377097.v1.
Code used to produce plot: Script to produce plot.