Data dashboards are pages that promote data and other research resources developed by projects involving Swedish researchers or institutes. The dashboards provide context for the resource, and usually dynamic data visualisations.
The dashboards are sorted according to when they were last updated, with the most recently updated shown first. All dashboards will be shown by default. Click on Updating to view only dashboards where data are still being updated. Click on Historic to see dashboards that include only historic data. To see dashboards relevant to a specific topic, click on the corresponding coloured topic tag at the bottom of the card (e.g. ‘COVID-19’, ‘Infectious diseases’, ‘Influenza’).
Data status

Updated:
The COVID Symptom Study Sweden (CSSS) collects data on COVID-19 prevalence, symptoms, and vaccinations through a smart phone app with over 200.000 users in Sweden. Raw data can be requested for use in research projects.

Updated:
A summary of the COVID-19 and SARS-CoV-2 publications produced involving at least one contributor from a Swedish university or research institute. Shows publications over time and key words/phrases within them.

Updated:
CRUSH Covid maps outbreaks in Uppsala County by visualising the number of cases, test positivity, and geographic distribution, among other things. Data for each postal code is available for download and reuse.

Updated:
A summary of the progress in developing a multi-disease serology assay, a key component of pandemic preparedness. Information about externally produced antigens is also provided.

Updated:
The Swedish Board of Health and Welfare (Socialstyrelsen) shares data on Post COVID-19 condition. Here, we show visualisations of data on symptoms, healthcare contacts, and geographic distribution, among other things.
Updated:
Dedicated to the work of the register-based large-scale national population study to monitor COVID-19 vaccination effectiveness and safety (RECOVAC) project.
Updated:
The national Pandemic Centre (NPC) conducted testing related to SARS-CoV-2 from the start of the pandemic. They show positive, negative, and inconclusive tests. This dashboard is historic, so no longer updated.

Updated:
Estimates of SARS-CoV-2 variant frequencies and growth rate advantages from global SARS-CoV-2 genotype sequencing data
Updated:
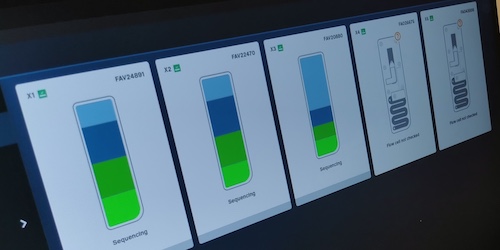
Surveillance of viral genome sequences is crucial in tracking the spread of viral variants. This dashboard shows whole-genome sequencing data generated by Uppsala University Hospital.

Updated:
The dashboard displays the SARS-CoV-2 serology tests completed over time at the at SciLifeLab Autoimmunology and Serology Profiling unit. The number of tests in total and the amount of positive/negative tests over time are shown.
Updated:
The Swedish Health Agency (Folkhälsomyndigheten) provide data and information related to COVID-19 in Sweden. Visualisations are shown on multiple aspects of vaccination coverage, like coverage in different counties.

Updated:
Enteric virus levels in Gothenburg’s wastewater, including norovirus and adenovirus. Data from the Norder group’s weekly analysis at Ryaverket WWTP helps predict outbreaks and includes samples from surrounding municipalities.

Updated:
Explore Influenza A and B virus levels in wastewater across Sweden. Weekly data from SLU-SEEC tracks Influenza trends, covering 43% of the Swedish population, and aids in predicting potential outbreaks.

Updated:
Explore Respiratory Syncytial Virus (RSV) levels in wastewater across Sweden. Weekly data from SLU-SEEC tracks RSV trends, covering a significant portion of the population, and assists in predicting potential outbreaks.

Updated:
Explore SARS-CoV-2 levels in wastewater across Sweden. Weekly data from SLU-SEEC tracks COVID-19 trends, covering 43% of the population, and aids in outbreak prediction.